

The DW beginner book you’ve been searching for!

Like all great stories, Let’s start with the History.
1. Background
- 1980’s to early 1990’s–Focus on computerizing business processes–To gain competitive advantage
- By early 1990’s–All companies had operational systems–It no longer offered any advantage
How to get a competitive advantage??
And then came the need for Data Warehousing

2. Data Warehousing
Companies, over the years, gathered huge volumes of data which turns out to be real “Hidden Treasures” and the question arises next was Can this data be used in any way? Can we analyze this data to get any competitive advantage? If yes, what kind of advantage?
3. Benefits of Data Warehousing
Let’s take a look at some major benefits which comes out as a result of data warehousing:
- Allows “efficient” analysis of data
- Competitive Advantage
- The analysis aids strategic decision making
- Increased productivity of decision-makers
- Potential high ROI
Classic example: Diaper and Beer ( Click here if you’re hearing this for the first time)
4. What is “A Data Warehouse”
Data Warehouse is a centralized data repository which can be queried for business benefit.
A Data Warehouse makes it possible to-
- Extract archived operational data.
- Overcome inconsistencies between different legacy data formats.
- Integrate data throughout an enterprise, regardless of location, format, or communication requirements.
- Incorporate additional or expert information.
Also, a DW is a decision support database that is maintained separately from the organization’s operational databases.
They both look familiar but use for different purposes.

Let’s put it as this way: A data warehouse is a
- Subject-oriented
- Integrated
- Time-varying
- Non-volatile
collection of data that is used primarily in organizational decision making. (Above four dot points are simply explained in next topic)
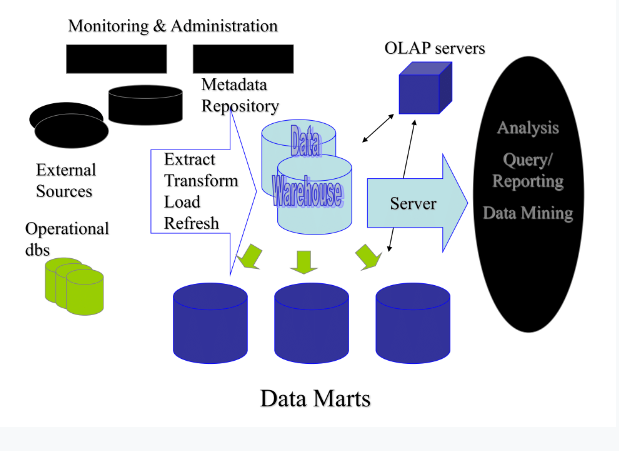
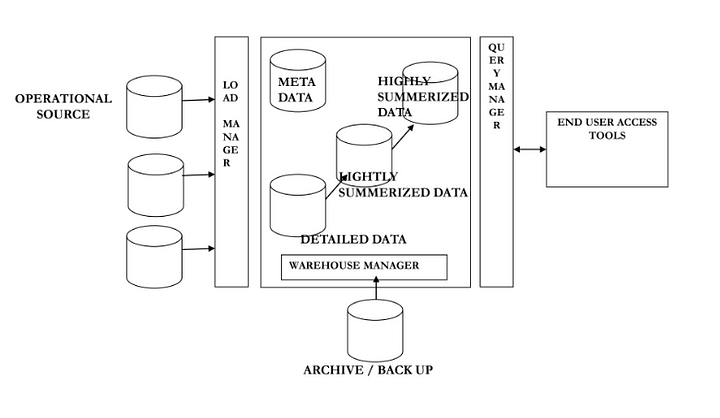
4.1. Data Warehouse Architecture
4.2 WHAT IS….
4.2 .1 Subject Oriented?
Data Warehouse is designed around “subjects” rather than processes.
A company may have Retail Sales System, Outlet Sales System, Catalog Sales System, The DW will have a Sales Subject Area

4.2.2 Integrated?
- Heterogeneous Source Systems ( Can be SQL, CSV files, text files or anything)
- Little or no control
- Need to Integrate source data
For Example, Product codes could be different in different systems
- Arrive at common code in DW
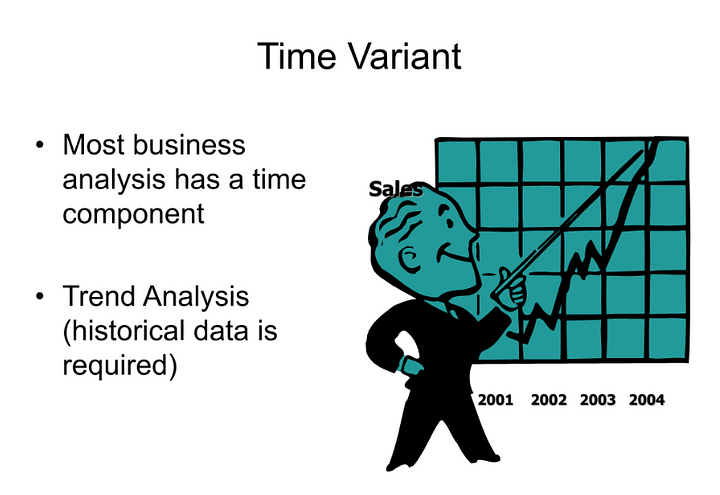
4.2.3 Time-Varying?
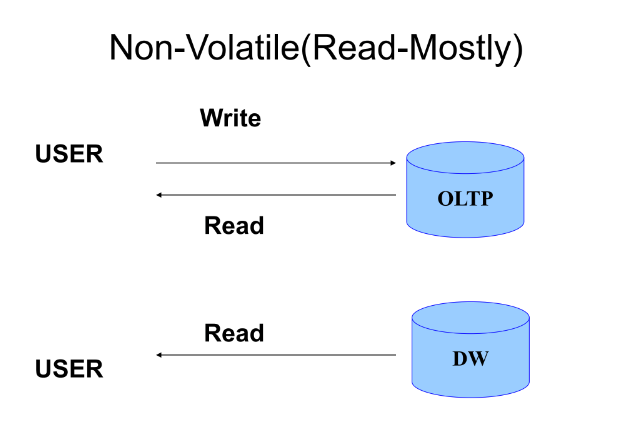
4.2.4 Non-Volatile?
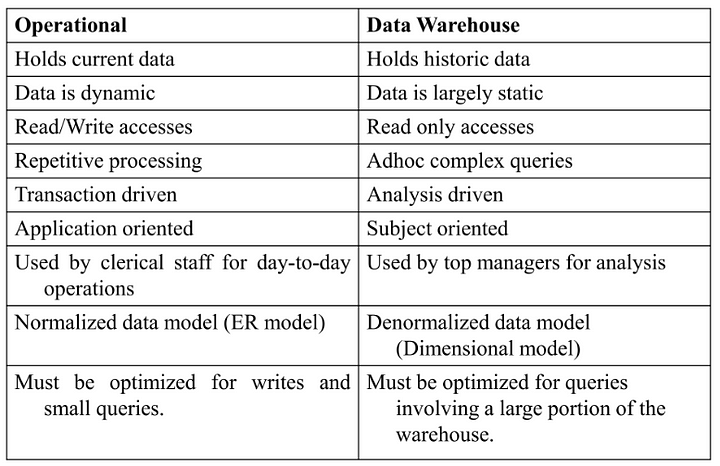
5. Data Warehouse Vs Operational DataBase
6. Populating & Refreshing the Warehouse
( Starting with here, I’ll simply use point-forms with simple language as you all can go through this fast and easily. )
- Data Extraction
- Data Cleaning
- Data Transformation (Convert from legacy/host format to warehouse format)
- Load (Sort, summarize, consolidate, compute views, check integrity, build indexes, partition)
- Refresh (Bring new data from source systems)
7. Data Staging Area
- A storage area where extracted data is
- Cleaned
- Transformed
- Deduplicated
AND..
- Initial storage for data
- Need not be based on the Relational model
- Spread over a number of machines
- Mainly sorting and Sequential processing
- Does not provide data access to users
- Analogy– (Kitchen of a restaurant)
7. Presentation Servers
A target physical machine on which DW data is organized for
- Direct querying by end-users using OLAP
- Report writers
- Data Visualization tools
- Data mining tools
- Data stored in Dimensional framework
- Analogy–Sitting area of a restaurant
8. Data Cleaning
Why?
Data warehouse contains data that is analyzed for business decisions. More data and multiple sources could mean more errors in the data and harder to trace such errors can result in incorrect analysis.
Detecting data anomalies and rectifying them early has huge payoffs.

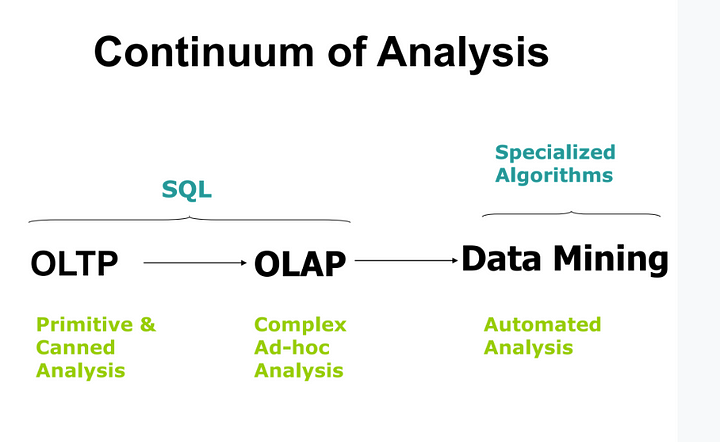
9. Analyzing the DATA
- Active Analysis–User Queries
- User-guided data analysis
- Show me how X varies with Y–OLAP
- Automated Analysis–Data Mining
- What’s in there?
- Set the computer FREE on your data
- Supervised Learning (classification)
- Unsupervised Learning (clustering)
9.1 OLAP Queries
- How much of product P1 was sold in 1999 ?
- Top 5 selling products in 2002.
- Total Sales in Q1 of FY 2002–03?
- Color wise sales figure of cars from 2000 to2003
- Model wise sales of cars for the month of Janfrom 2000 to 2003
9.2 Data Mining Investigations
- Which type of customers are more likely to spend most with us in the coming year?
- What additional products are most likely to be sold to customers who buy sportswear?
- In which area should we open a new store in the next year?
- What are the characteristics of customers most likely to default on their loans before the year is out?
10. Design Requirements
- The design of the DW must directly reflect the way the managers look at the business.
- Should capture the measurements of importance along with parameters by which these parameters are viewed.
- It must facilitate data analysis, i.e., answering business questions
11. ER Modeling
- A logical design technique that seeks to eliminate data redundancy
- Illuminates the microscopic relationships among data elements
- Perfect for OLTP systems
- Responsible for the success of transaction processing in Relational Databases
11.1 Problems with ER Model
ER models are NOT suitable for DW? Why?
- The end-user cannot understand or remember anER Model
- Many DWs have failed because of overly complex ER designs
- Not optimized for complex, ad-hoc queries
- Data retrieval becomes difficult due to normalization
- Browsing becomes difficult
12. ER vs Dimensional Modeling
- ER models are constituted to Remove redundant data (normalization), Facilitate retrieval of individual records having certain critical identifiers, Thereby optimizing OLTP performance
- The Dimensional model supports the reporting and analytical needs of a data warehouse system.
13.Dimensional Modeling
Salient Features
- Represents data in a standard framework
- A framework is easily understandable by end-users
- Contains the same information as the ER model
- Packages data in a symmetric format
- Resilient to change•Facilitates data retrieval/analysis
Vocabulary
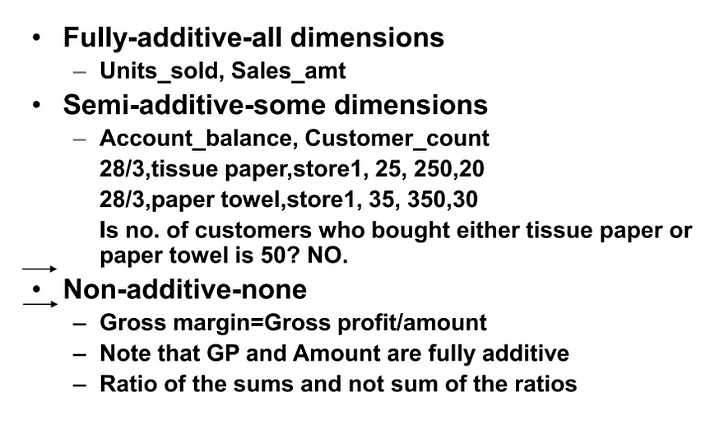
- Measures or facts
- Facts are “numeric” & “additive” (For example; Sale Amount, Sale Units)
- Factors or dimensions
- Star Schemas
- Snowflake & Starflake SchemasSales

Star Schema
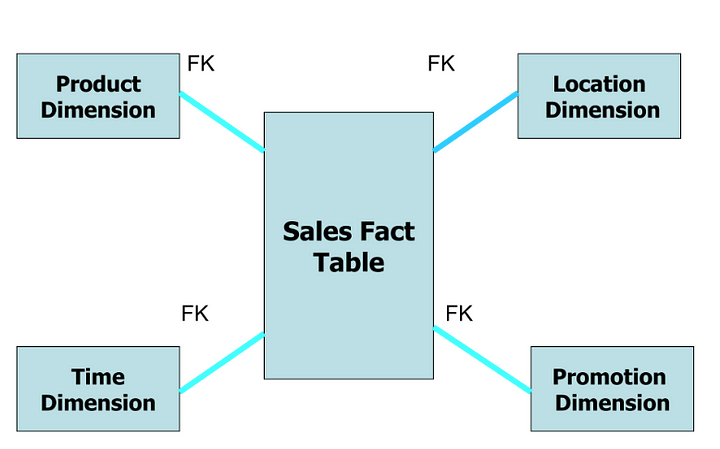
- Facts are stored in FACT Tables
- Dimensions are stored in DIMENSION tables
- Dimension tables contain textual descriptors of business
- Fact and dimension tables form a StarSchema
“BIG” fact table in the center surrounded by“SMALL” dimension tables
The Classic Star Schema

Fact Tables
- Contains numerical measurements of the business
- Each measurement is taken at the intersection of all dimensions
- The intersection is the composite key
- Represents Many-to-many relationships between dimensions
- Examples of factsSale_amt, Units_sold, Cost, Customer_coun
Dimension Tables
- Contains attributes for dimensions
- 50 to 100 attributes common
- Best attributes are textual and descriptive
- DW is only as good as the dimension attributes
- Contains hierarchal information albeit redundantly
- Entry points into the fact table
Types of Facts
14. Data Warehouse: Design
Step 1: Identify the Business Process
Step 2: Declare theGrain
Step 3: Identify the Dimensions
Step 4: Identify the Facts
15. Example of RDBMS
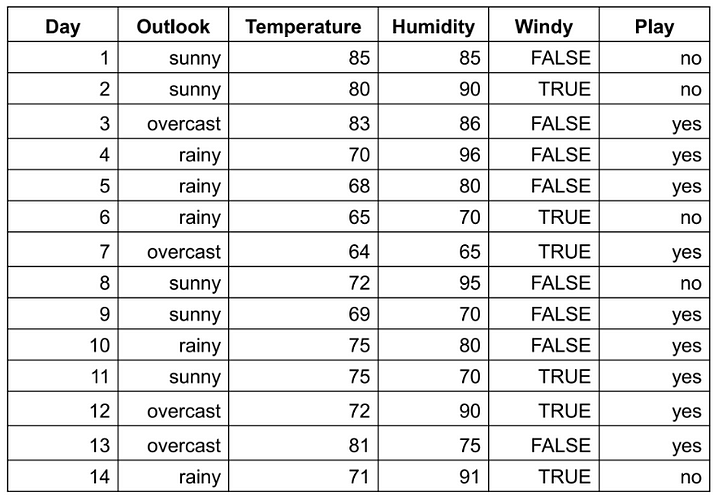
By querying a DBMS containing the above table we may answer questions like:
- What was the temperature in the sunny days?{85, 80, 72, 69, 75}
- Which days the humidity was less than 75?{6, 7, 9, 11}
- Which days the temperature was greater than70? {1, 2, 3, 8, 10, 11, 12, 13, 14}
- Which days the temperature was greater than70 and the humidity was less than 75? The intersection of the above two: {11}
16. OLAP
Using OLAP we can create a Multidimensional Model of our data (Data Cube). For example, using the dimensions: time, outlook and play we can create the following model.

Obviously here time represents the days grouped in weeks(week 1-days 1, 2, 3, 4, 5, 6, 7; week 2-days 8, 9, 10, 11,12, 13, 14) over the vertical axis.
- The outlook is shown along the horizontal axis and the third dimension play is shown in each individual cell as a pair of values corresponding to the two values along with this dimension-yes / no. Thus in the upper left corner of the cube, we have the total overall weeks and all outlook values.
- By observing the data cube we can easily identify some important properties of the data, find regularities or patterns. For example, the third column clearly shows that if the outlook is overcast the play attribute is always yes. This may be put as a rule:
if outlook = overcast then play = yes
17. Data Mining
- By applying various Data Mining techniques we can find associations and regularities in our data, extract knowledge in the forms of rules, decision trees, etc., or just predict the value of the dependent variable (play) in new situations.
Mining Association Rules
- To find associations in our data we first discretize the numeric attributes(a part of the data pre-processing stage in data mining). Thus we group the temperature values in three intervals (hot, mild, cool) and humidity values in two (high, normal) and substitute the values in data with the corresponding names.
Keen on getting to know me and my work? Click here for more!
Here’s the VIP Kindle Books for those who stayed till the end. You’re awesome!
- The Data Warehouse Toolkit: The Definitive Guide to Dimensional Modeling
- Data Warehousing For Dummies
- The Data WarehouseETL Toolkit: Practical Techniques for Extracting, Cleaning, Conforming, and Delivering Data
- Data Warehousing Fundamentals for IT Professionals
- Storytelling with Data: Visualization Guide


4 Comments
Great post!
ReplyDeleteThis comment has been removed by the author.
ReplyDeleteThank you for sharing your comprehensive guide to data warehousing—it's indeed a valuable resource! Your practical insights are incredibly helpful. For those eager to expand their understanding further, the resource on enterprise data warehousing you provided is an excellent addition: https://www.cleveroad.com/blog/enterprise-data-warehouse/. The combination of your guide and this resource forms a robust foundation for navigating the intricacies of data management.
ReplyDeleteThank you for sharing your post.. Finding reliable web hosting in 2025 can be difficult, but expert recommendations can make it easier. If you're looking for the best hosting solutions, this guide offers top suggestions tailored for all needs. Check it out: best web host reddit || The Best small business hosting reddit
ReplyDelete