

Why is it always R v Python? Why can’t we admit that both are unique in their own way and we should know how to leverage both of them at once!
Shiny is an R package that makes it easy to build interactive web apps straight from R. You can host standalone apps on a webpage or embed them in R Markdown documents or build dashboards. You can also extend your Shiny apps with CSS themes, Html widgets, and JavaScript actions.

When I started talking about R and R Shiny, People tend to ask me this question:
Why did you choose Shiny over Dash (By Plotly — Python)? Do they have the same level of complexity ? Which has a bigger community and why would someone prefer one over the other?
Ok, let’s breakdown the question into three parts.
- Why Shiny over Dash?
- Do they have the same level of Complexity?
- Who has the biggest community?
Here’s the answer:
Currently Shiny is far more mature than Dash. Dash doesn’t have a proper layout tool yet, and also not build in theme, so if you are not familiar with Html and CSS, your application will not look good (You must have some level of web development knowledge). Also, developing new components will need ReactJS knowledge, which has a steep learning curve.
I would say that right now Shiny might be a little better, especially if your needs are more complex dashboards, but I feel as Python community is so much larger, Dash is exponentially growing up and it could surpass shiny in general as Python can be used for multiple stuff and who knows what else Dash can evolve to be.
If you’re after more detailed comparison, click here.
AND... Who said you have to choose between one over another?
Because and this is my answer!: We are data scientists, We know how to code in R and Python both! Why can’t we use R+Python for our development right? It’s not rocket science it’s Data Science and that’s what we good at. Let’s see how to get the maximum out of R and Python for a Shiny Dashboard!
PART 01-CREATING A SHINY APP
The basic parts of a Shiny app

Shiny applications have two components, a user interface object and a server function, that are passed as arguments to the shinyApp function that creates a Shiny app object from this UI/server pair. The source code for both of these components is listed below.
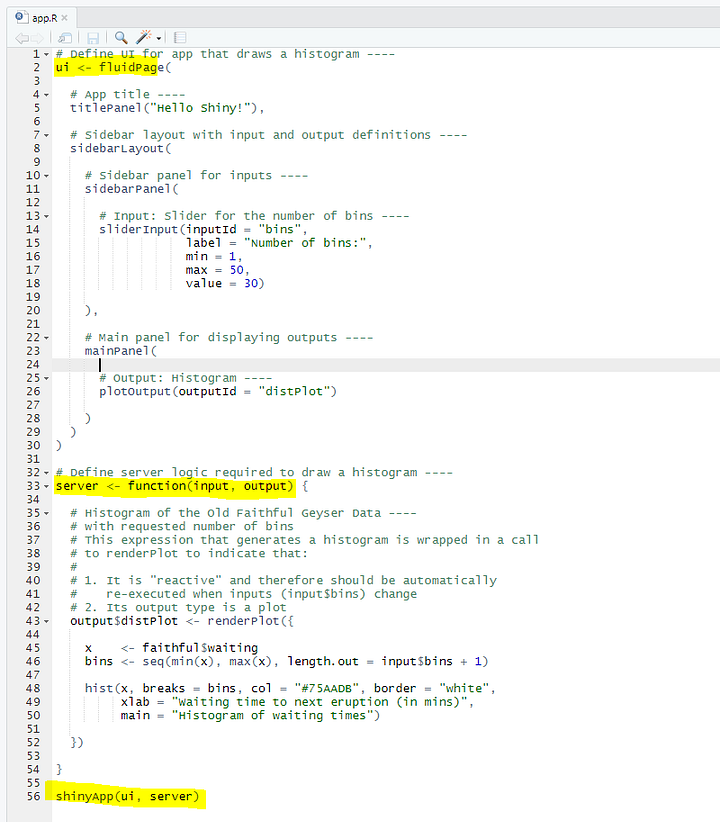
You can either create a one R file named app.R and create two seperate components called (ui and server inside that file) or create two R files named ui.R and server.R (figure 1.0)
In subsequent sections of the article, we’ll break down Shiny code in detail and explain the use of “reactive” expressions for generating output. For now, though, just try playing with the sample application and reviewing the source code to get an initial feel for things. Be sure to read the comments carefully.
Example:
The user interface is defined as follows: [Note that I’m going to create one .R file called app.R and will put these two code blocks inside of it]
ui
# Define UI for app that draws a histogram ----
ui <- fluidPage(

  # App title ----
  titlePanel("Hello Shiny!"),

  # Sidebar layout with input and output definitions ----
  sidebarLayout(

    # Sidebar panel for inputs ----
    sidebarPanel(

      # Input: Slider for the number of bins ----
      sliderInput(inputId = "bins",
                  label = "Number of bins:",
                  min = 1,
                  max = 50,
                  value = 30)

    ),

    # Main panel for displaying outputs ----
    mainPanel(

      # Output: Histogram ----
      plotOutput(outputId = "distPlot")

    )
  )
)
The server-side of the application is shown below. At one level, it’s very simple — a random distribution is plotted as a histogram with the requested number of bins. However, you’ll also notice that the code that generates the plot is wrapped in a call to renderPlot. The comment above the function explains a bit about this, but if you find it confusing, don’t worry, we’ll cover this concept in much more detail soon.
server
# Define server logic required to draw a histogram ----
server <- function(input, output) {

  # Histogram of the Old Faithful Geyser Data ----
  # with requested number of bins
  # This expression that generates a histogram is wrapped in a call
  # to renderPlot to indicate that:
  #
  # 1. It is "reactive" and therefore should be automatically
  #    re-executed when inputs (input$bins) change
  # 2. Its output type is a plot
  output$distPlot <- renderPlot({

    x    <- faithful$waiting
    bins <- seq(min(x), max(x), length.out = input$bins + 1)

    hist(x, breaks = bins, col = "#75AADB", border = "white",
         xlab = "Waiting time to next eruption (in mins)",
         main = "Histogram of waiting times")

    })

}
shinyApp
Finally, we use the shinyApp function to create a Shiny app object from the UI/server pair that we defined above
shinyApp(ui, server)We save all of this code, the ui object, the server function, and the call to the shinyApp function, in an R script called app.R. This is the same basic structure for all Shiny applications.
Your final code should look like this;
Then try to hit run and see what brings out to the browser page:
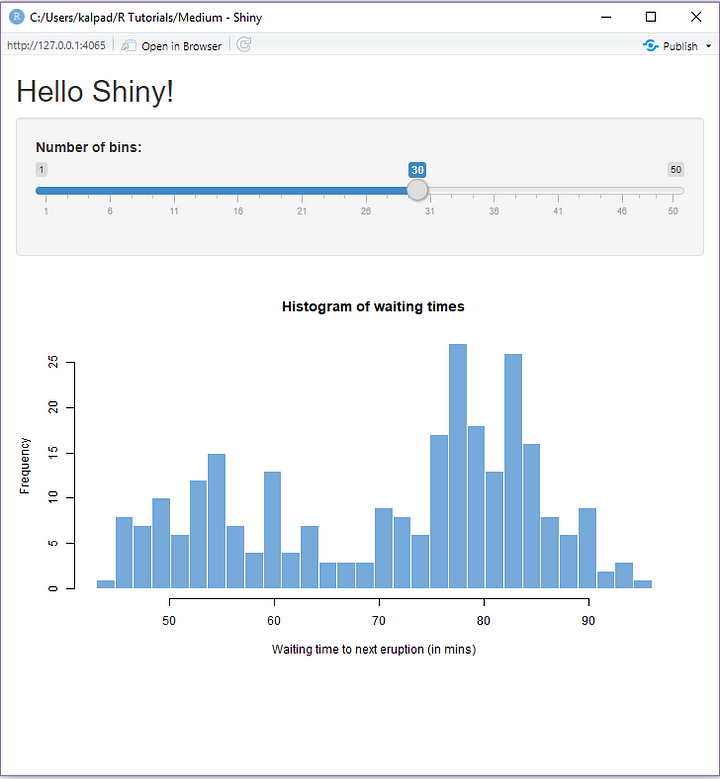
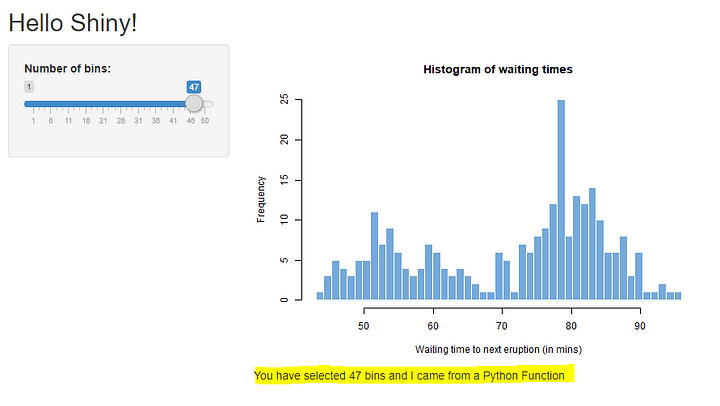
Try to change the Number of Bins Slider and experience how fast the Histogram making changes to the Number of Bins.
You’re doing good! Let’s have some snacks before moving on to the next phase.

PART II- HOW TO USE PYTHON SCRIPTS INSIDE R SHINY
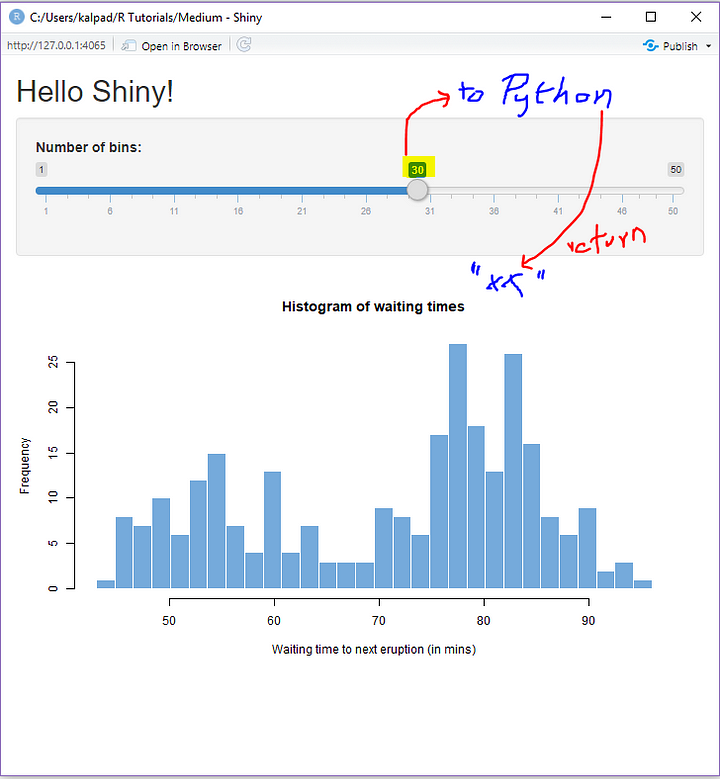
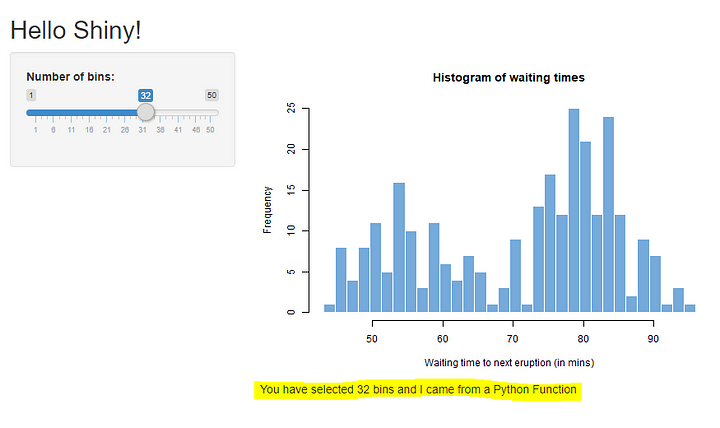
Now comes the title of my article and the most important part. For an instance, Let’s say that “I want to get the selected number of bins from the slider and pass that number into a python method and do some calculation/manipulation (return: “You have selected 30bins and I came from a Python Function”) inside of it then return some value back to my R Shiny dashboard and view that result in a text field.”
Whoa! I demand you to go back and read the bold sentence again to make sure that you get the idea and to make things easier I tried to draw my idea on this snip and please don't mind my handwriting :)
Ok now follow me!
Step 01
Create a textOutput in ui.R to display the final output. To do that, type the following after plotoutput()
textOutput("textOutput")
Step 02
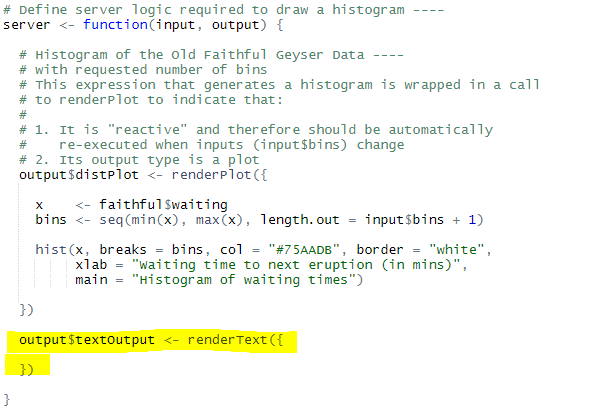
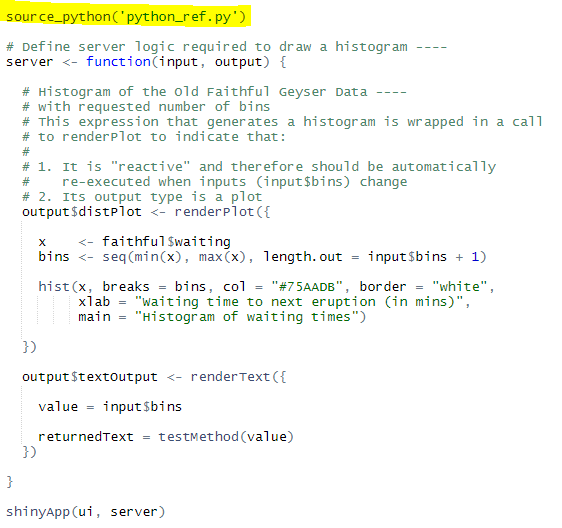
Create a handler on server.R by creating a renderText component for the above created textOutput.
output$textOutput <- renderText({

  })
Step 03
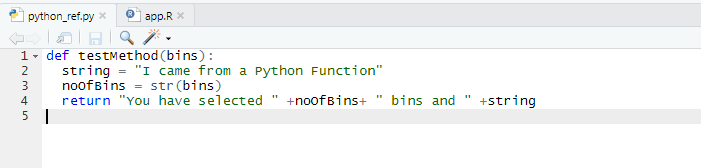
Create a new Python script called python_ref.py and insert the following code.
def testMethod(bins): //get number of bins passed by R Shiny server
  string = "I came from a Python Function"
  noOfBins = str(bins) //convert int to string to concat
  return "You have selected " +noOfBins+ " bins and " +string
Your .py file should like the following:
Step 04
Import reticulate library (If you don’t have python reticulate installed in your computer, please refer to this article and this for other information)
library(reticulate)Step 05
Sourcing Scripts
The source_python() function will source a Python script and make the objects it creates available within an R environment (by default the calling environment). For example, consider our Python script:
def testMethod(bins): //get number of bins passed by R Shiny server
  string = "I came from a Python Function"
  noOfBins = str(bins) //convert int to string to concat
  return "You have selected " +noOfBins+ " bins and " +string
To access its objects and functions in your R environment, type the following before you start server.R section of your app (You can declare this anywhere in your code outside ui.R and server.R, Best practice to use before server.R)
Step 06
OK guys, We’re almost there. Now before finalizing it make sure that you have two files inside your directory called
- app.R
- python_ref.py
and you have imported the reticulate package to R Environment and sourced the script inside your R code.
Let’s hit Run see if we succeeded or not! :)
Output:
TIME FOR ANOTHER CELEBRATION!

I have deployed this application on shinyapps.io so you can have the experience for yourself. ( Click on below Link )
I’ve uploaded the files to my GitHub so you can download and try to play with it using different components and python functions. Let me know if you run into any issues I’m more than happy to help you out.
Keen on getting to know me and my work? Click here for more!
Meanwhile, check my other posts as well:
Are we getting too many negative feedbacks? Why? How can we fix issues? What are we doing well and what have we…www.jayasekara.blog
Because that's a must, nowadays people don't tweet without emojis, as in a matter of fact it became another language…www.jayasekara.blog
In my previous article, I've talked about Face Detecting using Open CV with Haar Cascades. If you didn't have the…www.jayasekara.blog
As you all are familiar with importing, exporting and manipulating comma separate files (CSV) using Python, Hereby in…www.jayasekara.blog
THANK YOU SO MUCH!


1 Comments
Creating interactive dashboards in R Shiny using Python scripts as the backend. Python is widely used in software development, artificial intelligence, and data analysis, making it a valuable skill for students. Many learners explore Python Projects For Final Year to build practical applications using modern programming techniques. These projects often involve machine learning, data processing, and automation tasks. Python provides powerful libraries and frameworks that help students implement complex solutions efficiently. Working on Python-based projects helps students strengthen their coding skills and improves career opportunities in software and AI industries.
ReplyDeleteData science is an important domain for students who want to build careers in analytics, artificial intelligence, and machine learning. Many learners explore Data Science Projects for Final Year to gain practical experience working with real datasets and predictive models. These projects involve tasks such as data preprocessing, feature engineering, and model evaluation using statistical and machine learning techniques. Students also learn to use popular tools and frameworks like Python, Pandas, and Scikit-learn to analyze and visualize data effectively. Overall, working on data science projects helps students develop strong analytical skills and improves their career opportunities in data-driven industries.